|
 |
 |
 |
 |
|
|
|


Dose Response

The dose-response relationship is a fundamental and essential concept in toxicology. It correlates exposures and the spectrum of induced effects. Generally, the higher the dose, the more severe the response. The dose-response relationship is based on observed data from experimental animal, human clinical, or cell studies.
Knowledge of the dose-response relationship:
 |
 |
 |
|  | establishes causality that the chemical has in fact induced the observed effects
|
 |
|  | establishes the lowest dose where an induced effect occurs - the threshold effect
|
 |
|  | determines the rate at which injury builds up - the slope for the dose response.
|
 |
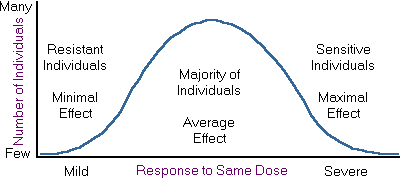
Within a population, the majority of responses to a toxicant are similar; however, a wide variance of responses may be encountered, some individuals are susceptible and others resistant. As demonstrated above, a graph of the individual responses can be depicted as a bell-shaped standard distribution curve.
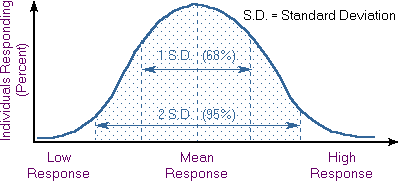
Dose responses are commonly presented as mean + 1 S.D. (standard deviation), which incorporates 68% of the individuals. The variance may also be presented as two standard deviations, which incorporates 95% of the responses. A large standard deviation indicates great variability of response. For example, a response of 15+8 mg indicates considerably more variability than 15+2 mg.
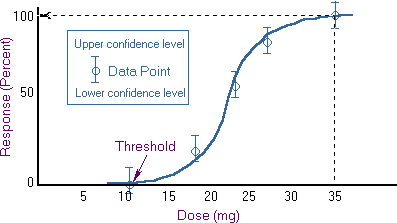
The dose-response curve normally takes the form of a sigmoid curve. It conforms to a smooth curve as close as possible to the individual data points. For most effects, small doses are not toxic. The point at which toxicity first appears is known as the threshold dose level. From that point, the curve increases with higher dose levels. In the hypothetical curve above, no toxicity occurs at 10 mg whereas at 35 mg 100% of the individuals experience toxic effects.
A threshold for toxic effects occurs at the point where the body's ability to detoxify a xenobiotic or repair toxic injury has been exceeded. For most organs there is a reserve capacity so that loss of some organ function does not cause decreased performance. For example, the development of cirrhosis in the liver may not result in a clinical effect until over 50% of the liver has been replaced by fibrous tissue.
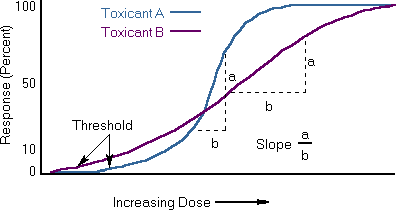
Knowledge of the shape and slope of the dose-response curve is extremely important in predicting the toxicity of a substance at specific dose levels. Major differences among toxicants may exist not only in the point at which the threshold is reached but also in the percent of population responding per unit change in dose (i.e., the slope). As illustrated above, Toxicant A has a higher threshold but a steeper slope than Toxicant B.

  
|
|
|
|


